By WorldwideScope World Desk
Also read: BRICS vs G7: The Global Power Shift Is Becoming Impossible to Ignore
Is BRICS More Powerful Than G7? The Short Answer
The answer to whether BRICS is more powerful than the G7 depends entirely on which dimension of power is being measured.
BRICS possesses a decisive advantage in measures of global physical scale, population, and raw resource dominance. Following its multi-phase expansion to 11 full members—Brazil, Russia, India, China, South Africa, Egypt, Ethiopia, Iran, Saudi Arabia, the United Arab Emirates (UAE), and Indonesia—the bloc accounts for 48.5% of the world’s population and roughly 40% of global Gross Domestic Product (GDP) when measured at purchasing-power parity (PPP). Furthermore, it holds central leverage over global energy, critical minerals, and agricultural supply chains.
However, BRICS has not surpassed the G7—comprising the United States, Canada, France, Germany, Italy, Japan, and the United Kingdom—across all structural dimensions of international influence.
The G7 retains structural advantages in nominal economic output, capital market depth, global military spending, advanced technology ecosystems, reserve-currency utility, and institutional cohesion.
| BRICS Advantages (Scale) | G7 Advantages (Institutions) |
|---|---|
| Population Share (~48.5% of World) | Nominal Economic Output ($52T vs $31T) |
| PPP GDP Output (~40% of Global Total) | Capital Market Depth & Financial Liquidity |
| Primary Energy Production (~43.6% Global Oil) | Military Expenditure & Formal NATO Alliances |
| Rare-Earth Reserves (~72% Global Total) | US Dollar Reserve & Transaction Hegemony |
| Long-Term Demographic & Consumption Growth | High-End Technological & Scientific Leadership |
The Core Verdict: BRICS has surpassed the G7 on fundamental measures of global economic scale and resource capacity, but it has not overtaken the G7 in financial, technological, military, or institutional power. The confrontation between the two blocs is not a single race with a definitive winner, but a competition between two distinct architectures of international influence.
BRICS vs G7: The Numbers at a Glance
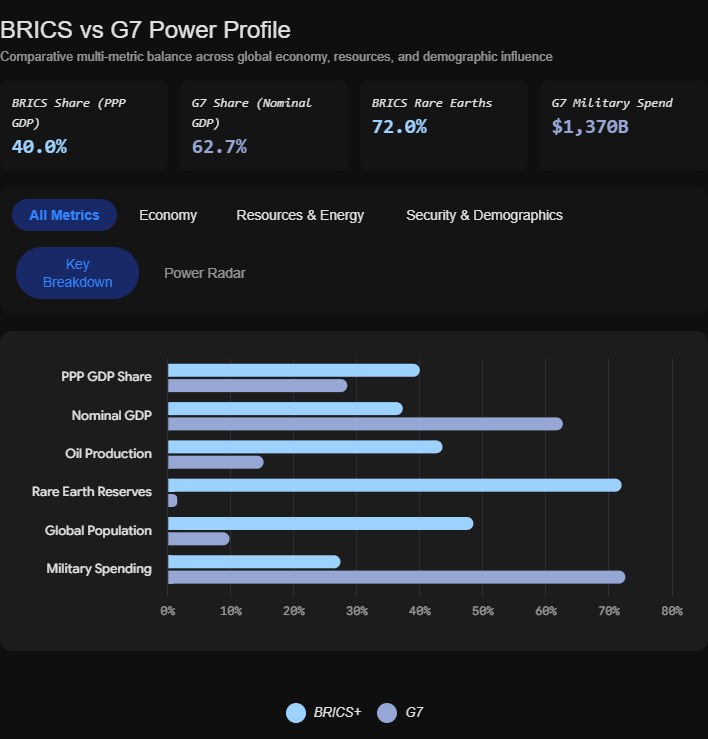
| Strategic Metric | BRICS (11 Members) | G7 (7 Members) | Current Structural Advantage |
|---|---|---|---|
| Full Members | 11 | 7 | BRICS (Broader geographic distribution) |
| Share of Global Population | ~48.5% | ~9.8% | BRICS (Nearly 5x larger human capital pool) |
| GDP at Purchasing Power Parity (PPP) | ~40.0% | ~28.5% | BRICS (+11.5 percentage point lead) |
| Nominal GDP (Market Exchange Rates) | ~$31.0 Trillion | ~$52.0 Trillion | G7 (Holds ~62.7% of combined output) |
| Global Military Spending | ~$518 Billion (Major) | ~$1.37 Trillion | G7 (Outspends BRICS by ~2.6 to 1) |
| Global Oil Production Share | ~43.6% | ~15.0% | BRICS (Dominates key energy exporters) |
| Global Natural Gas Production Share | ~36.0% | ~22.5% | BRICS (Led by Russia, Iran, Saudi, UAE) |
| Global Rare-Earth Mineral Reserves | ~72.0% | <2.0% | BRICS (Anchored by China & Brazil) |
| Global Merchandise Trade Share | ~24.0% | ~28.5% | G7 (Slight edge in overall value) |
| Innovation & Patents (WIPO Top 10) | 1 Country (China) | 4 Countries (US, UK, DE, JP) | G7 (Broader technological baseline) |
| Financial System Control | Local currency clearing | US Dollar / SWIFT | G7 (Dominates reserve assets & clearing) |
Understanding the Blocs: History, Composition, and Scope
What Is BRICS?
BRICS originated as an informal investment acronym formulated by Goldman Sachs in 2001 (BRIC: Brazil, Russia, India, China) to identify fast-growing emerging markets. It formalized into a diplomatic framework in 2009, added South Africa in 2010, and expanded significantly to 11 full members:
- Asia-Pacific & South Asia: China, India, Indonesia
- Eurasia: Russia
- Latin America: Brazil
- Middle East & North Africa: Egypt, Iran, Saudi Arabia, United Arab Emirates (UAE)
- Sub-Saharan Africa: Ethiopia, South Africa
The 2026 BRICS Summit in New Delhi emphasized deep cooperation across three core pillars: political and security coordination, economic and financial interoperability, and multilateral institutional reform.
BRICS Geographic Reach:
- Latin America — Brazil
- Africa — Egypt, Ethiopia, South Africa
- Middle East — Iran, Saudi Arabia, UAE
- Eurasia/Asia — Russia, India, China, Indonesia
This expanded footprint transforms BRICS from an economic forum into an expansive transcontinental network representing major agricultural exporters, industrial manufacturing hubs, energy producers, and maritime trade nodes.
What Is the G7?
Formed in the wake of the 1973 energy crisis, the Group of Seven (G7) represents an alliance of advanced industrial democracies:
- North America: United States, Canada
- Europe: France, Germany, Italy, United Kingdom (plus the European Union as a non-enumerated member)
- Asia: Japan
Unlike BRICS, the G7 is smaller, demographically mature, and deeply integrated. Its influence relies on accumulated capital, advanced industrial systems, institutional leadership across the IMF and World Bank, and security ties anchored by NATO and bilateral US treaties.
Population and Demographics: The Human Scale
BRICS holds a decisive demographic lead over the G7: BRICS members account for ~48.5% of the global population, the G7 ~9.8%, and the rest of the world ~41.7%.

China (~1.4 billion) and India (~1.43 billion) together account for over 2.8 billion people. Combined with Indonesia (~280 million), Brazil (~215 million), Russia (~144 million), Egypt (~112 million), Ethiopia (~126 million), Iran (~89 million), and others, the bloc represents almost half of the global population.
Strategic Demographics: BRICS Advantages
- Expanding Labor Force: While G7 nations contend with aging demographics and shrinking domestic labor pools, member states like India, Indonesia, and Ethiopia possess large, young working-age populations.
- Growing Consumer Base: The expansion of the global middle class is centered in BRICS economies, driving future demand for housing, automobiles, digital services, and consumer goods.
- Infrastructure & Digital Footprint: High population density accelerates the scale and adoption of digital payments, public tech infrastructure, and regional logistics networks.
Economic Output: Nominal GDP vs. Purchasing Power Parity (PPP)
Comparing economic strength between BRICS and the G7 requires analyzing both Nominal GDP and GDP at Purchasing Power Parity (PPP):
- Nominal GDP: G7 ~$52T (62.7%) vs BRICS ~$31T (37.3%)
- GDP at PPP: BRICS ~40.0% vs G7 ~28.5%
1. Nominal GDP: The G7 Advantage ($52T vs $31T)
Nominal GDP converts a nation’s total economic output into US Dollars using market exchange rates. It reflects a country’s purchasing power on global markets, its capacity to acquire foreign assets, and the valuation of its corporate entities.
- G7 Total: ~$52.0 Trillion USD
- BRICS Total: ~$31.0 Trillion USD
The United States economy alone (~$28.5 Trillion) accounts for a large share of global nominal GDP. This total gives G7 firms advantage in international capital markets, cross-border corporate acquisitions, and dollar-denominated trade finance.
2. GDP at Purchasing Power Parity: The BRICS Advantage (40% vs 28.5%)
PPP adjusts nominal output by accounting for local price levels and relative living costs. One US dollar purchases a significantly larger volume of real goods, labor hours, raw materials, and infrastructure in New Delhi, Beijing, or Jakarta than it does in New York, London, or Tokyo.
- BRICS Share: ~40.0% of Global PPP Output
- G7 Share: ~28.5% of Global PPP Output
Measured in real domestic goods, physical construction, industrial output, and service volumes, BRICS economies generate a larger total aggregate volume of domestic economic activity than the G7.
The Core Anchors: China and India
The trajectory of BRICS is heavily shaped by the economic output of China and India: China contributes ~58% of BRICS output, India ~15%, and the other 9 members ~27%.
China’s Contribution: Industrial and Supply Chain Scale
- Manufacturing Hub: Produces over 30% of global industrial manufacturing output.
- Processing Capacity: Dominates global refining and processing networks for lithium, cobalt, nickel, and rare-earth elements.
- Infrastructure Capital: Drives regional connectivity through physical logistics, port infrastructure, and export financing.
India’s Contribution: High-Growth Services and Demographics
- Growth Vector: Consistently records real GDP growth rates between 6.5% and 7.5%, making it a major engine of global demand.
- Services & Technology: Acts as a global center for IT services, software development, engineering design, and pharmaceutical manufacturing.
- Consumer Expansion: Features a rapidly rising middle class, serving as a primary market for global corporate growth.
Energy Geopolitics and Natural Resource Dominance
The addition of Saudi Arabia, the UAE, Iran, and Egypt alongside founding members Russia and Brazil transformed BRICS into an energy power. BRICS members control ~43.6% of global oil production, compared to ~15.0% for the G7.

Resource Endowments:
- Crude Oil Production: BRICS controls ~43.6% of total global daily crude production, anchored by Saudi Arabia, Russia, Iran, the UAE, and Brazil.
- Natural Gas Reserves: Controls ~36.0% of global natural gas production and a significant majority of proven reserves.
- Critical Minerals & Rare Earths: BRICS members control ~72.0% of global rare-earth element reserves, alongside major holdings in copper, iron ore, bauxite, and platinum-group metals.
| BRICS Critical Minerals Map | |
|---|---|
| Commodity | Primary BRICS Producers / Holders |
| Rare-Earth Elements | China (Processing Dominance), Brazil, Russia |
| Platinum Group | South Africa, Russia |
| Lithium & Cobalt | China (Refining), Brazil, Indonesia (Nickel) |
| Iron Ore & Bauxite | Brazil, India, China, Russia |
Military Power and Defense Spending
While BRICS possesses nuclear capability and substantial standing forces, the G7 holds a structural lead in combined military expenditure, technological integration, and formal treaty alliances. Annual military spending: G7 combined ~$1.37 trillion (US: ~$954B, others: ~$416B); BRICS major spenders ~$518 billion (China: $336B, Russia: $190B, India: $92B).
1. Expenditure and Technology (G7 Advantage)
- G7 Spending: Combined military expenditures exceed $1.37 Trillion, with the US accounting for roughly $954 Billion.
- Power Projection: The G7 maintains aircraft carrier strike groups, global satellite intelligence networks, foreign military bases, and integrated command structures.
2. The Nuclear Balance and Structural Differences
- Nuclear-Armed Nations: BRICS includes three recognized nuclear-weapon states (Russia, China, India). The G7 includes three (United States, France, United Kingdom).
- Alliance Architecture: G7 military power is linked through formal defense commitments like NATO, NORAD, and ANZUS. BRICS is not a military alliance and possesses no mutual defense clause or integrated command structure.
Technology, AI, and Innovation
The technological gap between the G7 and BRICS is shifting, driven by rapid industrial upgrades in China and growing software engineering capacity in India. On the WIPO Global Innovation Index profile: G7 economies hold multiple top spots (US: #3, UK: #6, Japan: #12), China sits at #10, and other BRICS members trail.
1. High-End Semiconductor & Frontier AI Leadership (G7 Lead)
- Semiconductor Architecture: G7 states control critical nodes in advanced microchip design, EUV lithography equipment (via European partners), and software synthesis tools.
- AI Infrastructure: The US leads in frontier foundation models, high-performance computing centers, capital deployment, and cloud infrastructure.
2. Scale Deployment & Applied Technology (BRICS Advance)
- China’s Technological Scale: China leads in global electric vehicle (EV) production, commercial battery chemistry, 5G/6G deployment, solar photovoltaic manufacturing, and high-speed rail.
- Top Innovation Clusters: According to WIPO data, China hosts 25 of the world’s top 100 science and technology clusters, surpassing the United States (20 clusters).
- India’s Digital Public Infrastructure: India’s unified public tech stack (UPI, Aadhaar, Open Network for Digital Commerce) provides a blueprint for scalable financial technology in emerging markets.
Global Financial Architecture and De-Dollarization
Financial leverage remains the G7’s most durable advantage, centered around the US Dollar’s position as the primary global reserve currency. Global currency reserve composition: US Dollar ~58.5%, Euro ~20%, Others ~21.5%.
Current Currency Reality:
- Reserve Dominance: The US Dollar represents roughly 58.5% of allocated global central bank foreign exchange reserves, with the Euro accounting for ~20%.
- SWIFT Clearing: Dollar-denominated transactions represent over 85% of foreign exchange trades and trade finance clearing.
The BRICS Alternative Approach: BRICS is not currently creating a single unified currency, but rather building mechanisms to reduce reliance on Western financial infrastructure:
1. Local-Currency Settlement Agreements
BRICS members are expanding bilateral trade settled in local currencies (such as Rupee-Dirham, Yuan-Ruble, and Real-Yuan trade), reducing exposure to exchange-rate friction and conversion costs.
2. Alternative Payment Systems
Developing interoperability between domestic financial messaging protocols—such as China’s CIPS, Russia’s SPFS, and India’s SFMS—to maintain transaction continuity.
3. Central Bank Digital Currency (CBDC) Interoperability
Testing multi-CBDC platforms (such as Project mBridge) to execute real-time, peer-to-peer cross-border wholesale transactions settled directly in central bank money.
4. The New Development Bank (NDB)
Expanding local-currency infrastructure loans through the Shanghai-based NDB, providing development finance without strict policy conditions.
Institutional Cohesion and Internal Friction
A key variable in comparing the two blocs is institutional unity.
| G7 Alliance Dynamics | BRICS Bloc Dynamics |
|---|---|
| Shared democratic governance structures | Diverse political systems & strategic goals |
| Established treaty mechanisms (NATO/OECD) | Bilateral friction (e.g., China-India border) |
| Unified financial sanctions coordination | Differing regional alignments in Middle East |
| Common alignment on key security priorities | Policy focused on consensus & non-alignment |
G7 Cohesion: Deep Institutional Alignment
Despite occasional trade disagreement, G7 members share political systems, economic models, and joint defense arrangements. This alignment allows the G7 to coordinate economic sanctions, technical standards, and diplomatic positions during crises.
BRICS Cohesion: A Diverse Multipolar Coalition
BRICS operates as a consensus-driven platform rather than a unified geopolitical bloc:
- Sino-Indian Strategic Competition: India and China retain distinct regional interests and engage in ongoing border management along the Line of Actual Control (LAC).
- Middle Eastern Balancing: The inclusion of Iran, Saudi Arabia, and the UAE brings diverse foreign policies into a single economic framework.
- Non-Alignment Preference: Members like India, Brazil, Indonesia, and South Africa explicitly avoid anti-Western alignments, viewing BRICS as a platform for Global South representation rather than an adversarial coalition.
Complete Category-by-Category Scorecard
| Dimension Category | Dominant Bloc | Primary Driver |
|---|---|---|
| Total Population | BRICS | China, India, Indonesia |
| GDP at PPP | BRICS | Emerging Market Output |
| Nominal GDP | G7 | US Economic Scale |
| Wealth Per Capita | G7 | High Average Income |
| Energy & Fuel Reserves | BRICS | Gulf Members + Russia |
| Critical Mineral Processing | BRICS | Chinese Industrial Base |
| Global Financial Clearing | G7 | US Dollar & SWIFT |
| Advanced AI Infrastructure | G7 | US Semiconductor Leadership |
| Manufacturing Output Volume | BRICS | China & India Industrial Base |
| Global Military Spending | G7 | US & NATO Defense Budgets |
| Formal Defense Alliances | G7 | NATO / Bilateral Treaties |
| Global South Representation | BRICS | Transcontinental Footprint |
| Internal Institutional Unity | G7 | Shared Governance Models |
Looking Ahead to 2030: Structural Trends Shaping the Balance
The relative balance of power between BRICS and the G7 over the next decade will be shaped by four main structural dynamics:
- Demographic Divergence: G7 nations face aging workforces and growing dependency ratios, while BRICS members like India, Indonesia, and Egypt benefit from expanding working-age populations.
- Resource & Commodity Control: As the global energy transition accelerates, BRICS dominance over both traditional hydrocarbons and critical transition minerals (lithium, nickel, cobalt, rare earths) gives the group significant leverage over global industrial supply chains.
- Fragmentation of Global Trade: The growth of local-currency settlement channels, regional supply chains, and near-shoring networks will gradually reduce the concentration of global trade cleared through single financial hubs.
- The Rise of Multipolar Governance: The growth of BRICS reflects a shift toward a multipolar international order, where middle powers leverage flexibility across regional and global institutions rather than aligning with a single economic bloc.
Final Verdict: What Kind of Power Matters Most?
Is BRICS more powerful than the G7 in 2026?
If power is defined by population size, real industrial production, commodity dominance, purchasing power parity, and long-term economic growth potential, then BRICS holds a clear advantage.
If power is defined by wealth per capita, global financial infrastructure, reserve-currency control, defense expenditure, advanced technological innovation, and institutional cohesion, then the G7 remains dominant.
Ultimately, BRICS and the G7 represent two distinct architectures of international influence. The defining story of the coming decade will not be the absolute victory of one group over the other, but how these two frameworks interact, compete, and share management of the global economy.
1 thought on “Is BRICS More Powerful Than G7 in 2026? The Real Answer”